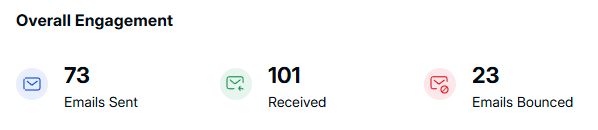
Emails Sent: — The number of outbound emails from the system.
Emails Received: — The total number of incoming emails.
Emails Bounced: — Emails that failed to be delivered due to various errors (e.g., invalid addresses, server failures).
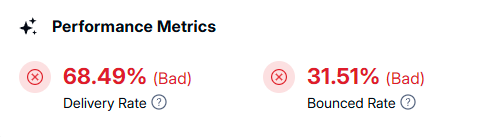
Delivery Rate: — A lower-than-optimal delivery rate indicates potential issues with recipient addresses or domain reputation.
Bounced Rate: — A high bounce rate can signal outdated email lists, blacklisted domains, or incorrect addresses.
This displays the mailboxes added to the domain and tracks the number of emails sent, received, and bounced for each mailbox. These insights help monitor email activity for individual users.

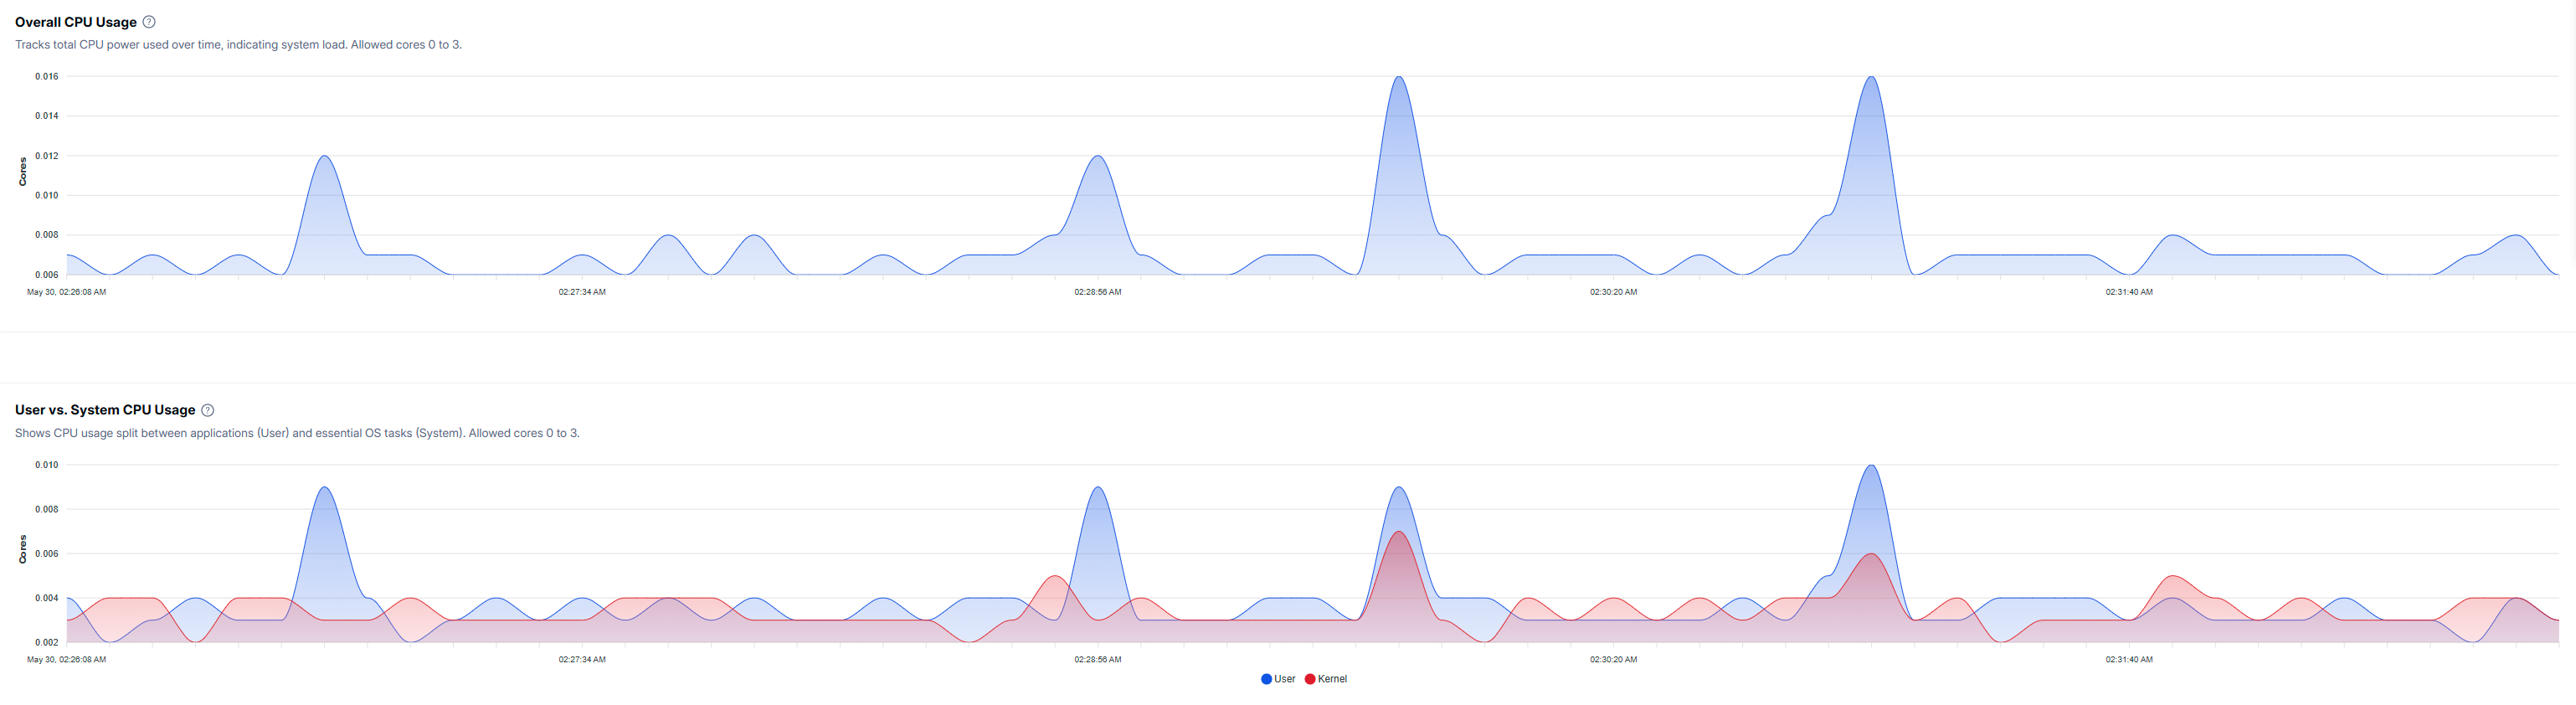
Tracks the total CPU power used over time, indicating system load. The allowed cores range from 0 to 3, ensuring controlled CPU allocation.
This metric provides a breakdown of CPU consumption:
User CPU Usage: Tracks resources used by applications and processes.
System CPU Usage: Represents CPU resources dedicated to essential operating system tasks.
Monitoring these figures ensures balanced resource distribution.
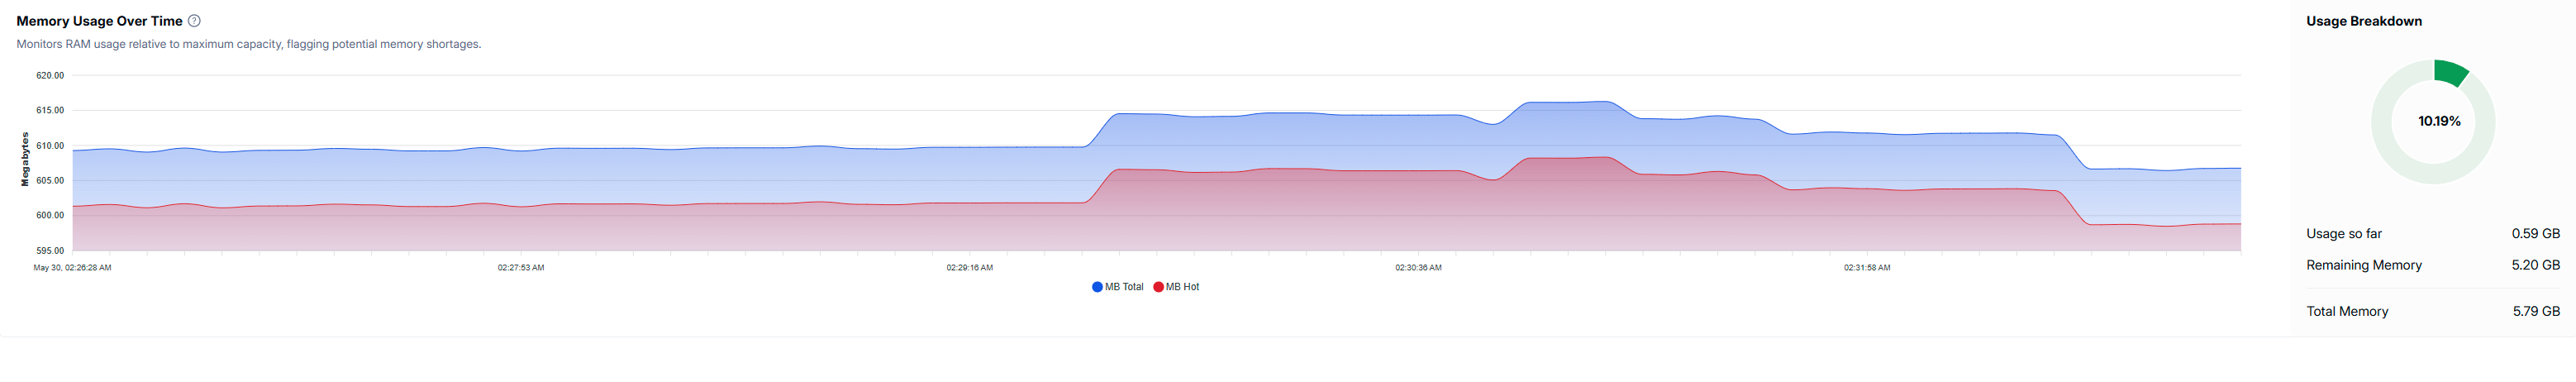
Provides real-time tracking of RAM consumption, helping to detect potential memory shortages.
Total Memory in GB
Remaining Memory in GB
Current Usage in Percentage
High memory consumption may require optimization to prevent performance slowdowns.
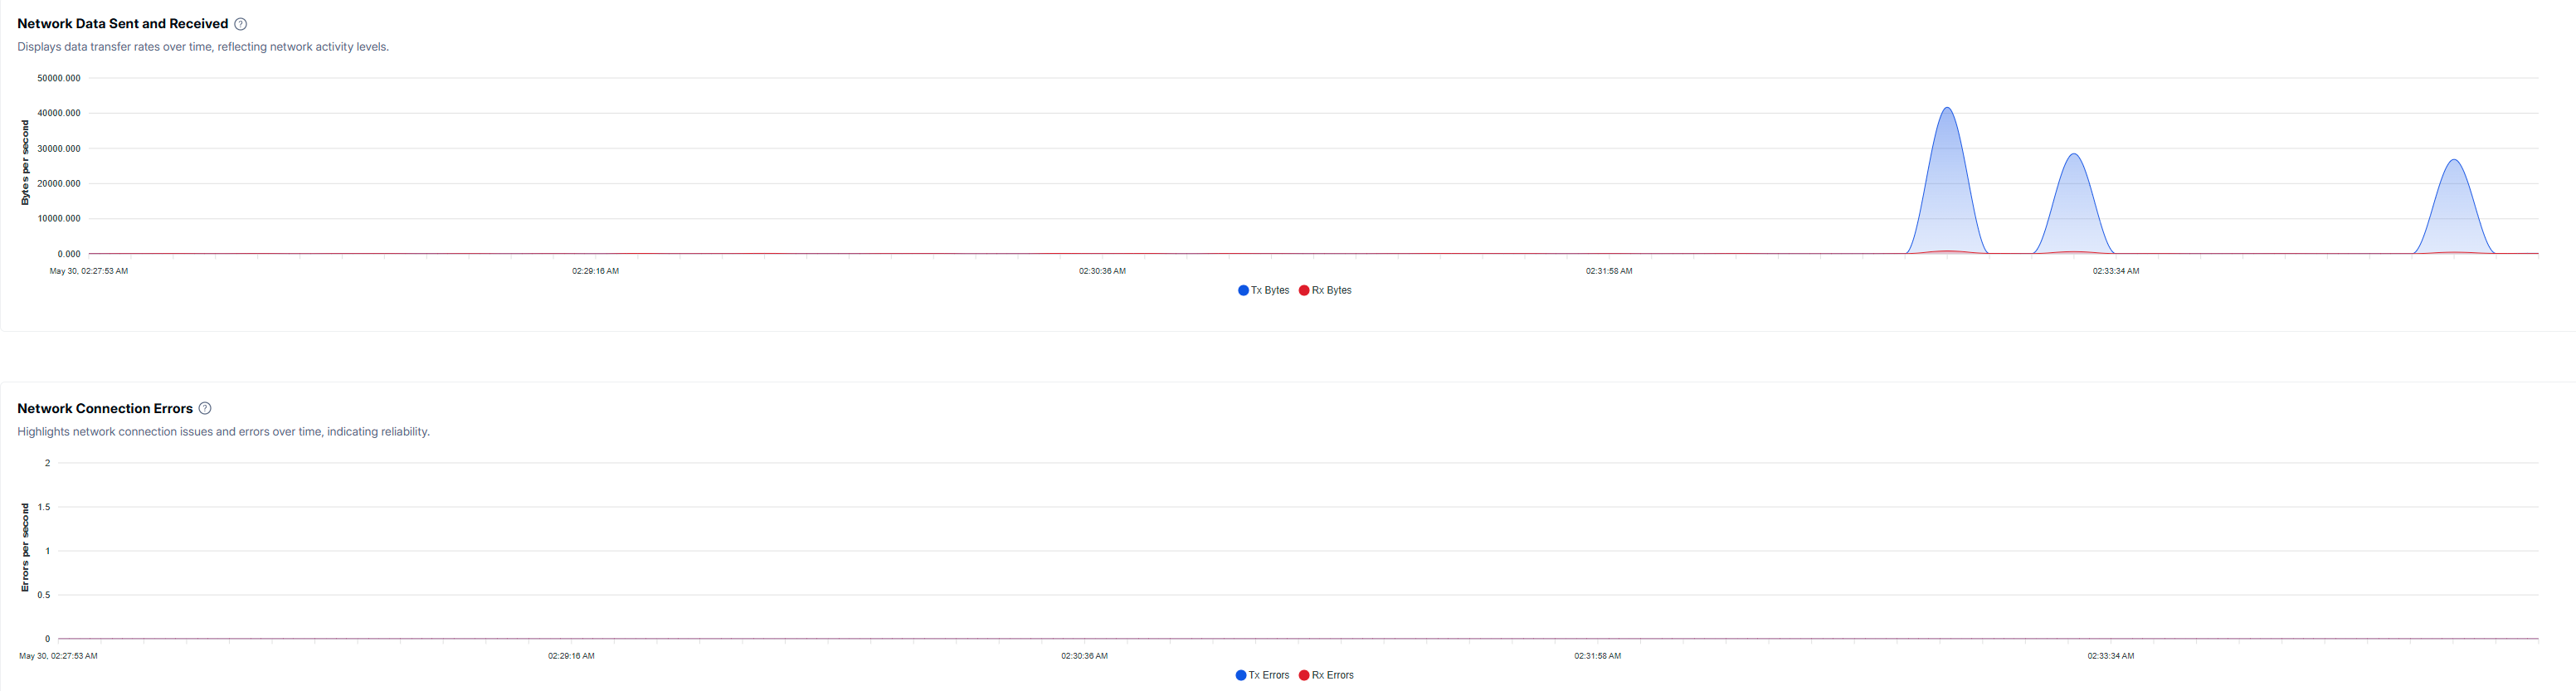
Displays data transfer rates to track network performance and bandwidth usage. This is crucial for identifying trends in network activity.
Monitors reliability by logging network disruptions and failures. A high error rate could indicate issues with connectivity, firewall settings, or external disruptions.